Git Analytics for Project Teams

This document provides information on how Team Leads and developers can leverage LinearB to support their activities in their assigned project team efficiently.
The document is organized around their responsibilities to make it a practical guide, i.e., each section is one of the areas for which they are responsible.
Team Leads
The primary responsibility for Team Leads is to lead the efficient development and timely delivery of the sprints. Git analytics can play a significant role in ensuring the efficiency of the backlog, the development of stories, and code reviews.
Issues are not only detected earlier but also more efficiently. Indeed, using a tool also enables monitoring to be asynchronous and continuous. Instead of disruptive check-ins in person or via chat (e.g., “How are you doing on your tasks today?”), Team Leads can first check on LinearB to assess if actions are needed and raise informed concerns to the developers.
Backlog Efficiency
Team Leads must ensure the backlog assignment is strategic and efficient throughout the sprint. Any issues in the assignment of some stories can negatively impact the delivery of the overall sprint. By using Git analytics, Team Leads can proactively detect issues more efficiently and earlier.
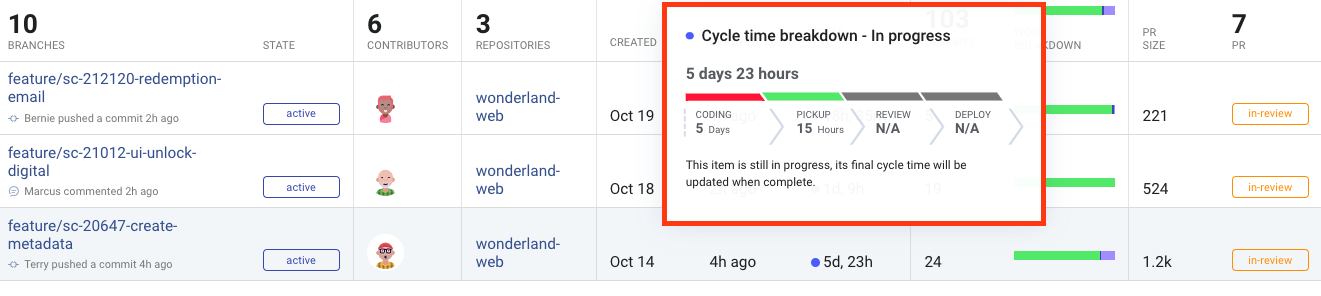
On the LinearB Dashboard for the project, the team table provides a high-level view of the team’s throughput and work-in-progress.
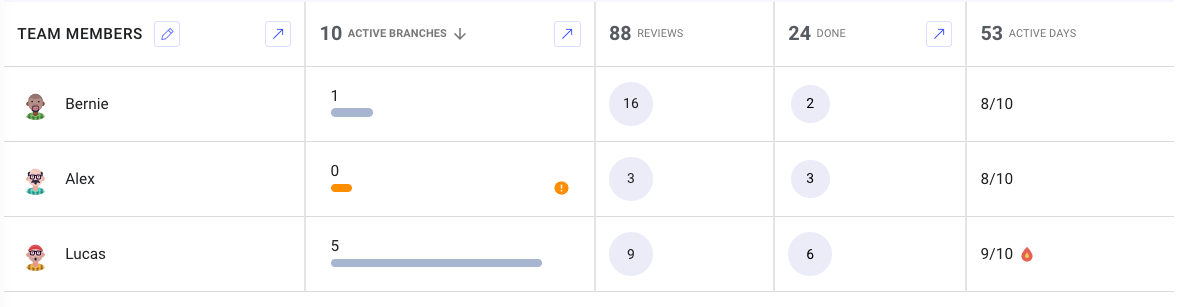
Team Leads can ensure that developers:
-
Have an active branch.
Developers who do not have an active branch might not have picked up a new story or might be stuck.
-
Do NOT have too many active branches.
Many active branches can signify that developers are over-tasked or multitasking, thus juggling too much work-in-progress. Such cases can negatively impact the sprint’s delivery, and completing work-in-progress must be favored over picking up new tasks. Fixing a pull request will get the project team closer to completing the sprint goals since it will increase the completed work and reduce the work-in-progress.
Upon investigating directly with the concerned developers, Team Leads can adjust the backlog assignment to ensure the workload is spread evenly and efficiently across all team members.
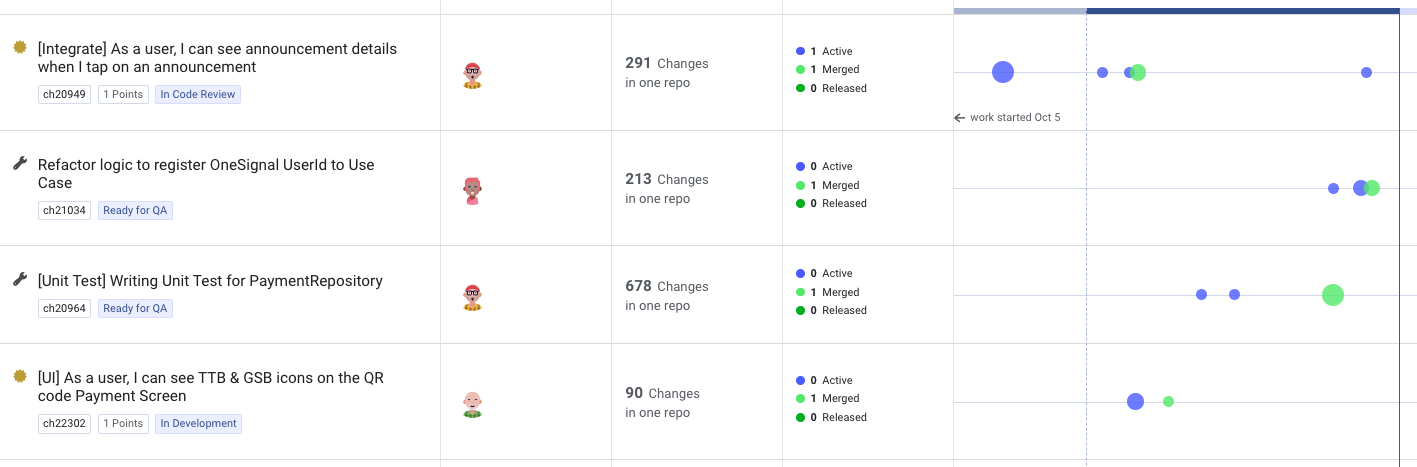
On the Activity page, Team Leads can also ensure that developers work on the stories in the prioritized order:
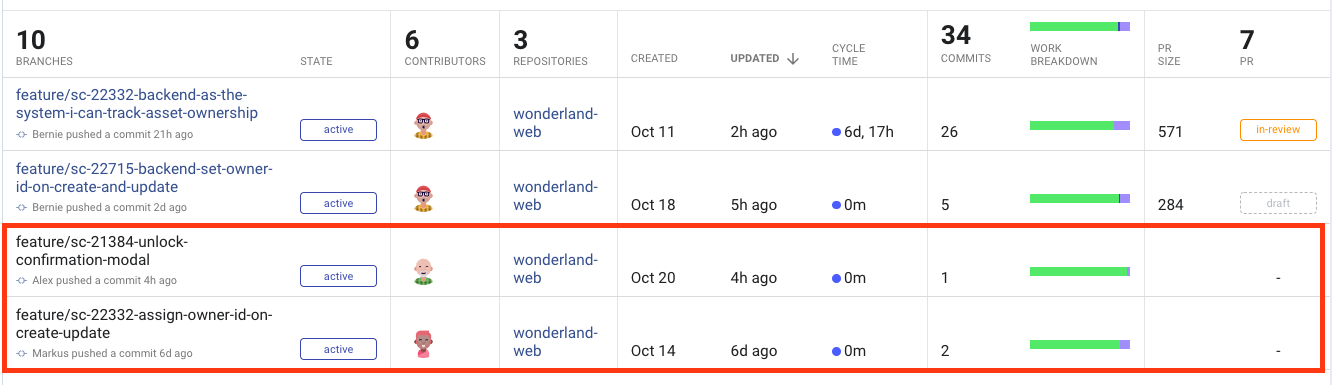
Even if developers have yet to update the story status on the project management platform (e.g., Shortcut or JIRA), work on branches for those stories can be monitored, thus giving another perspective to their actual current work.
It can also happen that the prioritization of some stories changes mid-sprint. Thus knowing how much efforts developers have already allocated to a story can support the decision of Team Leads on the change of task assignment. Indeed, suppose the Product Manager de-prioritizes a task, but the developer has already spent a significant amount of time on it. In that case, Team Leads can use this information to recommend keeping this task in the sprint or adjusting the sprint velocity since that work will not be part of the product increment even though time has already been spent on it.
Development of Stories
Since project teams work in one-week or two-week sprints, progress in completing the backlog must be regularly assessed and monitored. Any issues in the completion of some stories can negatively impact the delivery of the overall sprint.
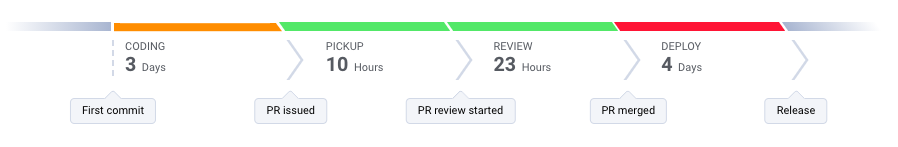
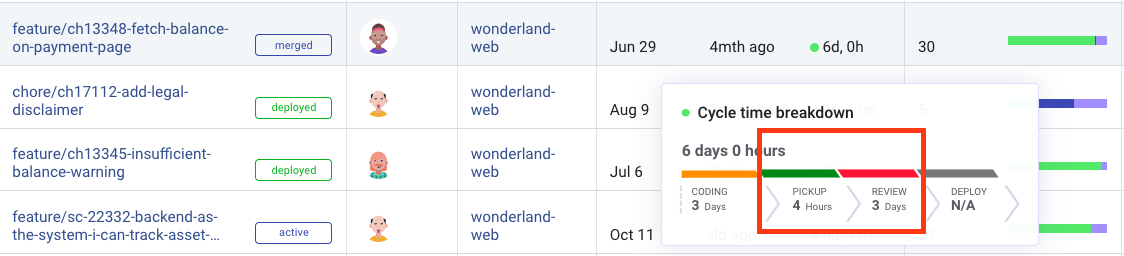
On the LinearB Dashboard for the project, the Cycle Time for the current sprint is calculated in “real-time”.
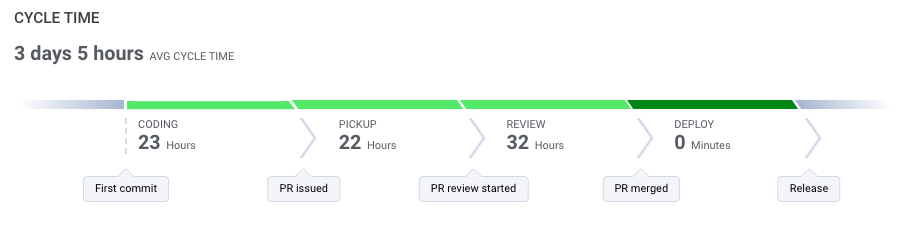
An efficient Cycle Time has the following characteristics:
- Consistently between 2-3 days on average for each sprint.
- Each metric composing Cycle Time is in the efficient range, thus colored in light or dark green.
When a metric composing Cycle Time is not within the optimal range, the corresponding part in the Cycle Time is colored in either orange or red.
Team Leads can use the overall Cycle Time to gauge the bottlenecks in developing stories faced by the project team.
To investigate further, Team Leads can use the detailed insights on the current progress on assigned tasks via the Activity page. Their attention must be, for this purpose, on keeping track of the Cycle Time and, more specifically, Coding Time at the branch and individual level.
Inefficiencies in Coding Time can originate from development and product management issues. For the former, developers might be slower due to personal technical and collaboration aptitude or skills. As for product-management-related issues, there might be deficiencies in the backlog items for the sprint, e.g., lack of documentation on the product features, unclear acceptance criteria, etc. Therefore, Team Leads must act and collaborate with the concerned developer and Product Manager to resolve the situation at the earliest.
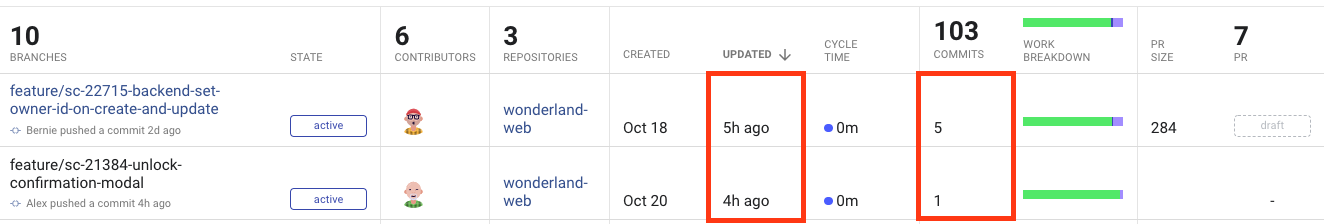
Team Leads must also ensure that progress is continuously made without significant gaps. The Pulse page provides a high-level view of commits and merges at the branch level. A gap of several days between commits can signify a developer is stuck, thus requires assistance.
The above table provides insights into the regularity of commits on each branch.
Code Reviews Management
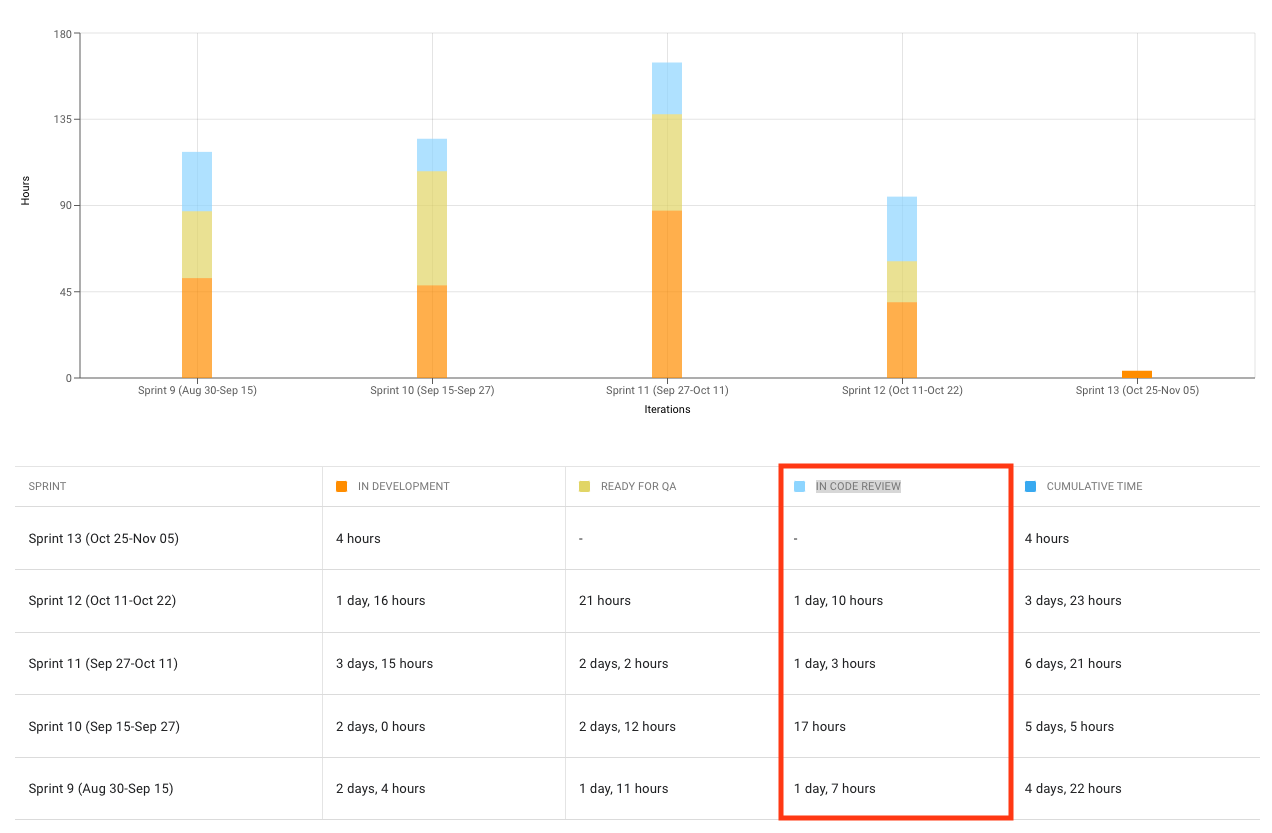
Like for Development of Stories, the overall Cycle Time on the Dashboard is the primary tool to monitor code reviews efforts. However, their focus must be on the metrics Pickup Time and Review Time for code reviews management.
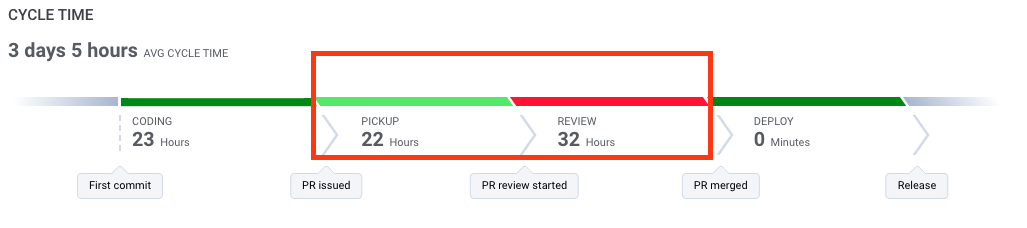
An efficient code reviews management has the following characteristics:
- Pickup Time is less than one day on average.
- Review Time is between one to two days on average.
Team Leads must continuously ensure that the developers in the project team dedicate enough time for code reviews in each sprint.
In case of deficiencies and to investigate further, like for Development of Stories, Team Leads can also use the detailed insights at the branch and individual level via the Activity page.
Team Lead can use this information to rally the efforts of the project team on the branches that have the longest Pickup Time and Review Time, thus unblocking these “stuck” pull requests.
In addition to the time-related metrics, Team Leads must also ensure quality in the code reviews in each sprint. They must monitor the Review Depth graph at the project team and sprint level on the Quality metrics page.
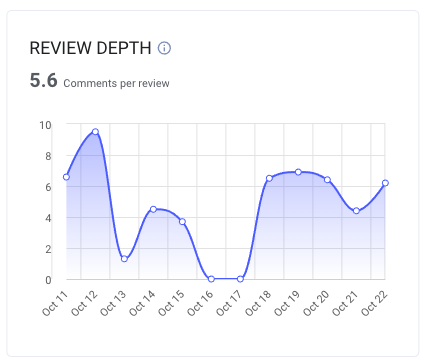
An efficient Review Depth reviews management has the following characteristics:
- Above four comments per review on average.
-
Constant throughout the sprint.
Significant punctual bursts can negatively impact the overall Review Time and signify that code reviews are also performed punctually instead of daily.
Developers
Code Review Assistance
To fulfill their code review efforts, developers must use the Slack bot provided by LinearB called WorkerB. Once connected, developers can:
-
Get personal alerts when a pull request is assigned to them, a change on a pull request is needed, and a pull request is approved.
The notifications are personalized, thus sent directly to each developer, i.e., the notifications are not sent into the activity channel for the project.
- List all the pull requests they need to review.
- Get an estimated Code Review time for a pull request.
The bot serves as a personal assistant to ensure each developer can manage their code review workload more efficiently.
Individual Growth
While Engineering Leads and Team Leads are the primary and direct users of Git analytics, developers can benefit from the insights. Through One-on-Ones and Peers Feedback, Engineering Leads can share and use Git analytics with their reports to fulfill their responsibility of nurturing and assessing developers. Such data sharing can also be done at the inquest of developers. Whether to assess their impact as code reviewers or interest in their Cycle Time over time, developers can request access to their personal data in their current project for individual growth.